Warehouse space, grid capacity and data centers across five regions
Three buildouts measured the same way, per capita, across the United States, Europe, the GCC, China and India. Eleven years of history and five years of announced pipeline.
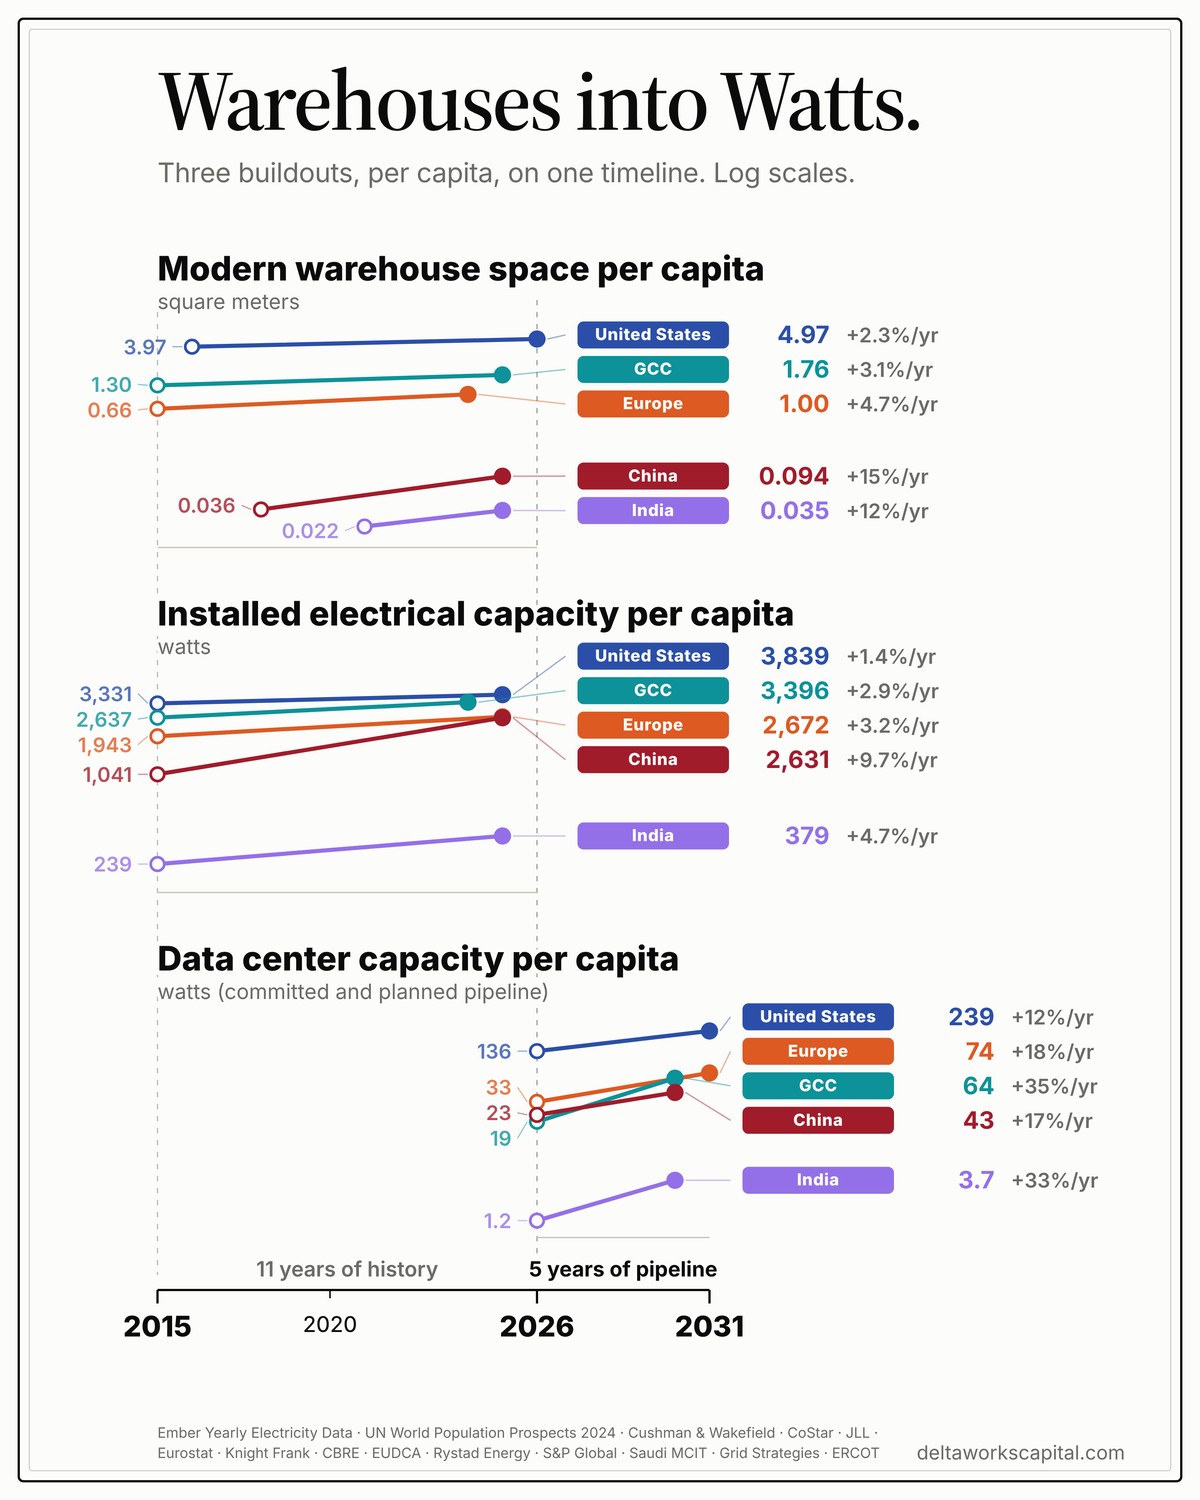
Amazing what you can do with research tools now. If all the data center projects already under construction and in permitting actually happen, what would data center capacity be (per capita, per region) and how will it have changed over time? And how does that compare to the historic growth of logistics real estate across these same regions? (Approximately, of course).
Check it out:
Modern warehouse space, square meters per capita, over the past decade
| US | 3.97 to 4.97 |
|---|---|
| Europe | 0.66 to 1.00 |
| GCC | 1.30 to 1.76 |
| China | 0.036 to 0.094 |
| India | 0.022 to 0.035 |
Installed power capacity, watts per capita, 2015 to now
| US | 3,331 to 3,839 |
|---|---|
| Europe | 1,943 to 2,672 |
| GCC | 2,637 to 3,396 |
| China | 1,041 to 2,631 |
| India | 239 to 379 |
Data center capacity, watts per capita, today through the next five years
Assuming the committed and planned pipeline delivers.
| US | 136 to 239 |
|---|---|
| Europe | 33 to 74 |
| GCC | 19 to 64 |
| China | 23 to 43 |
| India | 1.2 to 3.7 |
Some observations
America has far and away the highest warehouse space per capita, and is growing slowest. The same is shaping up with data centers. But even growing slowest, the US is still projected to have more capacity per capita than anyone in 2031.
The above assumes committed and planned capacity is built. Alongside CoreWeave's credit spreads, and Elon Musk's comments on the guppy death in the neoclouds this weekend, this likely will not happen according to plan. (One rule of thumb is that one project in four is real). But even if it does, the grid probably can't accommodate all of it anyway (even if much of it is behind the meter). In the US, announcements total 780 GW against a peak load of 759 GW.
China's growth in electrical capacity, both production and transmission, may be the message here, and will likely enable future data center capacity. It added 1,590 watts per capita over the decade against America's 508, going from 54% of Europe's level to 98%. It put in 533 GW of generating capacity in 2025 alone against only 39 GW for America. State Grid alone will spend $574bn over the next five years, around $115bn a year, against Europe's grid investment of 69bn eur.
Europe's constraint isn't the power generation at all, but almost entirely the grid. Europe spends about 69bn euros a year on grid infrastructure against the 81 to 124bn needed. 8,800km/year of transmission is built vs. about 17k needed. A large transformer is a four-year order.
The GCC, like China, is growing fast and planning centrally, which makes it more likely to put the pieces together.
For the data center projections to materialize, power generation and grid capacity have to increase everywhere.
These are estimates. Happy to share data, sources, and methodology with those interested.
In short
- How much warehouse space does each region have per capita?
- Measured in modern, institutionally tracked stock: the United States about 4.97 square meters per capita, the GCC 1.76, Europe 1.00, China 0.094 and India 0.035. The United States has roughly fifty times China's figure on this basis. The gap is partly real and partly a counting problem, because a great deal of Chinese warehouse space is attached to factories and never appears in broker inventories.
- How much data center capacity is planned per capita by 2031?
- If everything committed and planned is delivered: the United States would reach about 239 watts per capita, Europe 74, the GCC 64, China 43 and India 3.7. The United States starts from the highest base, at about 136 watts per capita today, and has the slowest growth rate of the five at roughly 12 percent a year. The GCC compounds fastest at about 35 percent a year and still ends below a third of the American level.
- Is the announced data center pipeline actually deliverable?
- Probably not in full. In the United States, announced projects total around 780 GW against a national peak load of 759 GW. A common industry rule of thumb is that roughly one announced project in four is real. Credit conditions have tightened sharply: CoreWeave's bond yields moved near 15 percent and its credit default swaps reached distress levels in October 2026. Even where financing holds, grid capacity is a separate and binding constraint.
- Why is Europe's constraint the grid rather than generation?
- Europe added installed generating capacity faster than the United States over the decade, from 1,943 to 2,672 watts per capita against 3,331 to 3,839. The shortfall is in the wires. European grid investment ran about 69 billion euros in 2024 against an estimated 81 to 124 billion a year required. Transmission is being built at roughly 8,800 km a year against about 17,000 km needed, and a large transformer is a four-year order.
- How much electrical capacity did China add compared with the United States?
- China added 1,590 watts per capita over the decade against America's 508, moving from 54 percent of Europe's level to 98 percent. In 2025 alone China added 533 GW of generating capacity on a net basis against 39 GW for the United States. State Grid plans to spend about 574 billion dollars over the next five years, roughly 115 billion a year, against European grid investment of about 69 billion euros a year.
- Why measure data center capacity per capita at all?
- Because it makes the three buildouts comparable, not because compute is consumed locally. Warehouse space and grid capacity are local by physics: both serve the population and the economy around them. A data center does not. One in Dublin serves Europe, one in Loudoun County serves the world, and the Gulf is building for demand that does not live there. Per capita is the right lens for the first two series and a deliberately imperfect one for the third.